How to define business metrics once, version them in Git, and serve them consistently to every dashboard, notebook, and AI agent in your stack
The Idea in One Sentence
A semantic layer lets you define business metrics — revenue, active users, conversion rate, whatever matters to your organisation — once, as code, and serve them consistently to every tool and consumer in your data stack.
That’s the pitch. This article is the practice. I’ll walk through the mechanics of building a semantic layer using dbt, MetricFlow, and semantic models – the actual components, how they fit together, and the decisions you’ll face along the way.
No vendor evangelism. Just the architecture and the trade-offs.
Why Metrics Belong in the Transformation Layer
If you have worked in data for any length of time, you have encountered the metric consistency problem. Revenue means one thing in the finance dashboard and another thing in the marketing report. Customer count includes trial users in one tool and excludes them in another. Everyone is technically “correct” — they’re just using different definitions.
The root cause is that most organisations define metrics at the BI layer — inside their visualisation tools. This means definitions are tool-specific, not version-controlled, and invisible to non-BI consumers like AI agents, notebooks, or APIs.
A semantic layer moves those definitions down into the transformation layer — the governed, testable, version-controlled layer where your data models already live. Metric definitions become YAML files in a Git repository, reviewed in pull requests, tested in CI/CD, and consumed identically by every downstream tool.
This isn’t just a tidy architectural principle. It has a concrete effect: change a metric definition once, and it updates everywhere. No more parallel maintenance across tools. No more “which number is right?” debates.
The Three Building Blocks
The dbt semantic layer is built on three interlocking components. Understanding how they relate is essential before writing any YAML.
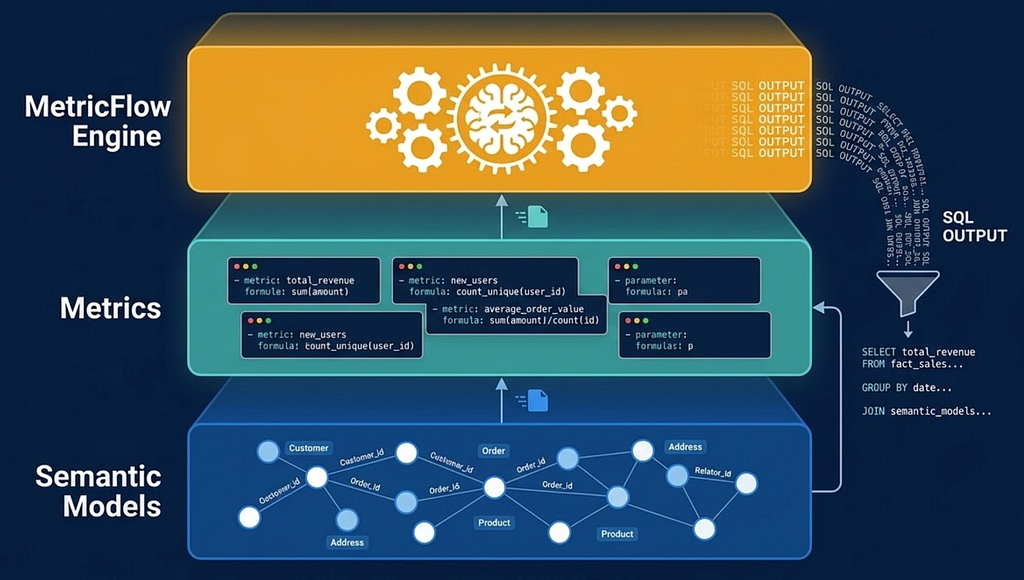
1. Semantic Models — Mapping Business Concepts to Physical Data
A semantic model is an abstraction layer that sits on top of an existing dbt model. It doesn’t replace your models or change your warehouse structure. Think of it as an annotation — it tells the query engine what your data means in business terms.
Every semantic model declares three types of metadata:
Entities are the join keys. They define how tables connect to each other — the traversal paths in the semantic graph. If your orders table has a customer_id that links to a customers table, that's an entity. Entities are what MetricFlow uses to figure out join paths when constructing queries.
A practical analogy: entities are like the edges on a map. They don’t carry data themselves, but they define how you navigate from one place to another.
Measures are the raw aggregations. A measure declares an aggregation function — sum, count, count_distinct, average, min, max — applied to a column in the underlying table. For example, sum(transaction_amount) on your orders model, or count_distinct(user_id) on your events model.
Measures are not metrics. They’re ingredients. A single measure might feed into multiple metrics. Think of measures as the atomic building blocks — they define what can be computed, not what should be reported.
Dimensions are the attributes you slice by. Time dimensions (order date, signup month, fiscal quarter). Categorical dimensions (region, product category, subscription tier, channel). Any attribute that a business user might want to filter or group by.
Here’s the mental model: semantic models define what data you have and how it connects. Metrics define what questions you can ask.
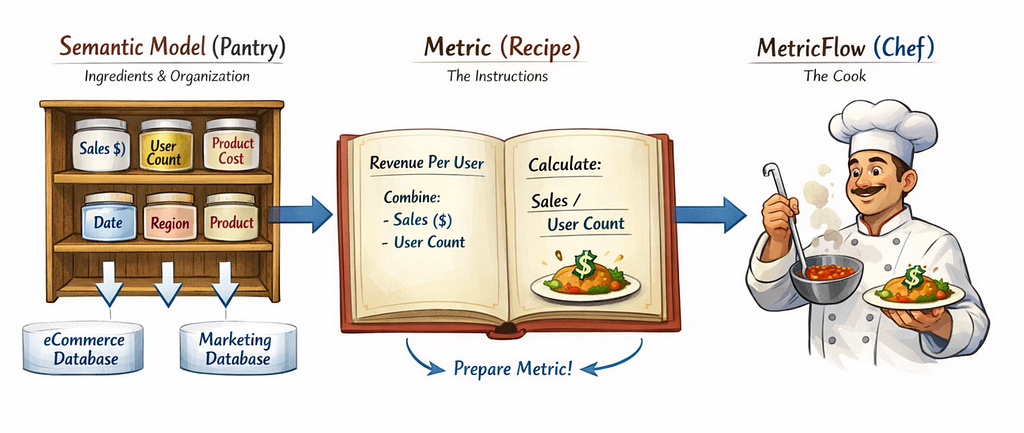
An Everyday Analogy
Imagine a recipe. The semantic model is like your pantry — it declares what ingredients you have (measures), how they’re organised (dimensions), and which pantries connect to which kitchens (entities). The metric is the recipe itself — it says “combine these ingredients in this way to produce this dish.” MetricFlow is the chef who reads the recipe and does the actual cooking.
2. Metrics — Defining Business Logic as Composable Code
Metrics are the business-facing definitions. They sit on top of measures and express the calculations stakeholders actually care about.
The dbt Semantic Layer supports four metric types, and they’re designed to be composable — each type can reference others, so you define logic once and recombine it freely.
Simple metrics reference a single measure directly. Total revenue. Total signups. Distinct active users. These are your foundational building blocks — the metrics that map directly to a single aggregation.
When to use: any metric that’s a straight aggregation. “How many X do we have?” or “What’s the total Y?”
Ratio metrics divide one metric by another. Revenue per user. Cost per acquisition. Defect rate. The numerator and denominator are each governed metrics themselves, so the ratio inherits their consistency.
When to use: any metric that’s one number divided by another. The key benefit is that if the numerator metric’s definition changes, the ratio automatically updates.
Cumulative metrics compute running totals over time. Year-to-date revenue. 90-day rolling active users. Cumulative signups since launch. You define the time window and the grain; MetricFlow handles the window function SQL.
When to use: when business users need “as of” or “over the last N days” metrics. These are notoriously error-prone to implement by hand because window function logic varies by platform.
Derived metrics are the most flexible type. They let you write arithmetic expressions that combine other metrics. Need (metric_a - metric_b) / metric_c? A derived metric handles it, and each component metric retains its own governance.
When to use: any metric that’s a formula combining other metrics. The power here is composability — you never duplicate the underlying logic.
Why Composability Is the Key Insight
The four types aren’t just categories. They’re a composition system. A ratio metric’s numerator can be a simple metric. A derived metric can reference a cumulative metric. This means you build a library of well-defined atomic metrics and then combine them into increasingly complex business calculations — without ever duplicating logic.
In practice, this changes how data teams think about metrics. Instead of building each new metric request from scratch (writing SQL, figuring out joins, handling edge cases), you compose it from existing, tested components. It’s the same shift that happened in software engineering when teams moved from monolithic scripts to modular, reusable functions.
3. MetricFlow — The SQL Generation Engine
MetricFlow is the engine that ties it all together. It reads your YAML definitions and translates metric requests into optimised SQL for your specific data platform.
Here’s what happens when someone (or something) asks for a metric:
- Parse the request — “Give me monthly active users by region for the last 12 months”
- Resolve the metric — look up the YAML definition, identify which measures and semantic models are involved
- Plan the query — determine the optimal join path between the required tables, using entity relationships
- Generate SQL — construct platform-specific SQL (Redshift, Databricks, Snowflake, BigQuery, or others)
- Return or execute — either hand back the compiled SQL or execute it and return results
The critical point: you never write the aggregation SQL yourself. MetricFlow generates it from your declarative definitions. This means the SQL is provably correct — it’s derived from governed definitions, not hand-written under time pressure.
MetricFlow is now open source under the Apache 2.0 licence and is being developed as part of the Open Semantic Interchange (OSI) initiative — a cross-vendor effort involving dbt Labs, Snowflake, Salesforce, Atlan, Alation, and others. The goal is vendor-neutral standards for semantic data exchange. Your metric definitions aren’t locked into any single platform.
Where It Sits in the Stack
A common question is where the semantic layer fits relative to the rest of the data platform. Here’s the mental model:

Without the semantic layer, there’s a direct — and ungoverned — path from your data marts to each consumption tool. Each tool interprets the data on its own terms.
With the semantic layer, every consumer goes through a governed intermediary. The metrics, the joins, the aggregation logic are defined once and enforced everywhere.
Practical Decisions You will Face
Where to Start
Don’t try to model your entire warehouse on day one. Start with the most contested metrics — the ones that generate the most “is this number right?” conversations. These have the highest ROI because the trust problem is already visible.
A good first batch is 5–10 core metrics with the semantic models they depend on. Define them, validate against existing reports, ship them, and then expand.
How Semantic Models Map to dbt Models
Semantic models don’t require a one-to-one mapping with dbt models. You can create multiple semantic models from a single dbt model — useful when a wide fact table serves multiple business domains. You can also have semantic models that connect across multiple dbt models through entity relationships.
The only hard constraint is that every semantic model must reference an existing dbt model as its base. Semantic models are an annotation layer; they add meaning to structure that already exists.
Aligning With Your Data Catalogue
If your organisation already maintains metric definitions in a data catalogue (Alation, Atlan, DataHub, or similar), the semantic layer should implement those definitions, not replace them. The catalogue defines what a metric means in business terms. The semantic layer defines how that metric is computed in code.
The goal is alignment: for every metric definition in your catalogue, there’s a corresponding YAML definition in your dbt project that makes it executable and enforceable.
Testing and Validation
Metrics should be tested like any other code. Use MetricFlow commands to query metrics locally during development and validate results against known baselines. Add dbt tests to the underlying models for data quality constraints. And during rollout, compare outputs to existing “trusted” reports — if they don’t match, you’ve surfaced a bug in either the report or the definition, and both outcomes are valuable.
Multi-Platform Environments
If your organisation runs multiple data platforms — a warehouse for reporting and a lakehouse for advanced analytics, for example — the semantic layer can serve both. MetricFlow generates platform-specific SQL, so the same YAML definitions produce correct queries whether they’re executed on Redshift, Databricks, Snowflake, BigQuery, Postgres, or Trino.
This is especially valuable for organisations with hybrid architectures. Metric consistency across platforms without maintaining parallel definitions.
The Compounding Return
Here’s why this investment pays off disproportionately over time:
Day one, you get metric consistency across your core reports. One definition, one source of truth. That alone eliminates a significant class of “which number is right?” issues.
Month three, your BI tools are querying the semantic layer natively. Self-serve analytics starts to become real because business users can trust the numbers without manual validation.
Month six, you’ve built a library of composable metrics. New metric requests that used to take days of SQL development now take hours of YAML composition from existing, tested building blocks.
Month twelve, an AI agent connects to your semantic layer through the Model Context Protocol. It answers natural language questions using the same governed metrics as your dashboards. You didn’t build anything new for AI — the foundation you built for reporting consistency was already exactly what AI needed.
The governed foundation you build today becomes the structured context that every future consumer — human or machine — inherits.
Metrics as Code: Building a Semantic Layer With dbt and MetricFlow was originally published in Towards Data Engineering on Medium, where people are continuing the conversation by highlighting and responding to this story.
This article was originally published at https://medium.com/towards-data-engineering/metrics-as-code-building-a-semantic-layer-with-dbt-and-metricflow-93d7e29e6ab3?source=rss-670f6306e3c0------2