BI-as-Code treats dashboards and metrics as version-controlled, testable, reusable code artefacts closing the last remaining gap in the modern data stack where visualisation has traditionally lagged behind orchestration and transformation. If your team has adopted dbt for transformation and Airflow for pipelines, but still clicks through Tableau to update a dashboard, this article is for you. By the end, you will understand what BI-as-Code is, why it matters, and how tools like Rill Data make it practical today.
dbt-conversation-ai-local/rill-dashboard at main · alwyndsouza/dbt-conversation-ai-local
Overview
Most data teams have done the hard work of operationalising their pipelines. Ingestion is automated. Transformations are version-controlled in dbt. Tests run in CI before code merges. And then almost paradoxically the final step in the chain, the dashboard that stakeholders actually look at, is managed through a GUI with no Git history, no automated testing, and metric definitions duplicated across a dozen different views.
This article is for data engineers, analytics engineers, and platform engineers who want to apply the same software engineering discipline to their BI layer that they’ve already applied everywhere else.
We will start by defining BI-as-Code as a concept, move into a concrete architecture showing how it sits alongside dbt in the modern data stack, work through a real-world scenario that illustrates the problem it solves, and close with an honest look at its trade-offs and where this trend is heading.
The Problem: BI as an Afterthought
Walk into almost any data team and you will find a version of this story. The team runs dbt transformations on a schedule, models are peer-reviewed in Git, and data quality tests catch regressions before they reach production. But ask them how the revenue dashboard is maintained and the answer is usually some variation of: “Sarah owns that one in Tableau” — or worse, “there are three different revenue dashboards and we are not sure which one is right.”
This isn’t a people problem. It’s a tooling problem. Traditional BI tools — Tableau, Power BI, Looker (in its point-and-click form) — were not designed with software engineering workflows in mind. Dashboard definitions live in proprietary formats or databases, not flat files.
There is no native Git integration. Metric logic gets copy-pasted across views. When a definition changes, there’s no automated way to validate that change before it propagates to production.
The result is what I call metric drift: the slow, invisible divergence of business definitions across dashboards that erodes trust in data over time. As we will see in the next section, BI-as-Code addresses this at the architectural level — not with process changes, but with a fundamentally different approach to how dashboards are built and deployed.
What Is BI-as-Code?
BI-as-Code is an approach where your entire data visualisation stack — metrics, dimensions, dashboard layouts, data source connections — is defined in declarative code (SQL + YAML or similar configuration files), version-controlled in Git, and deployed through CI/CD pipelines.
The analogy writes itself: if dbt brought software engineering discipline to the transformation layer, BI-as-Code does the same for the presentation layer. You are not clicking through a GUI to build a chart. You are writing a YAML file that declares what a chart is, referencing a SQL metric that is itself version-controlled and tested.
Three principles underpin the BI-as-Code philosophy:
1. Declarative Over Imperative
Instead of imperatively building a chart through a series of GUI interactions, you declare what the chart should be. A dashboard becomes a configuration file — readable, diffable, and reviewable by anyone on the team with Git access. Changes are explicit, not implicit.
2. Single Source of Truth for Metrics
Define total_revenue once. Reference it everywhere. No more "which revenue number is this?" conversations in stand-up. This is the DRY (Don't Repeat Yourself) principle applied to metric definitions — the same principle that makes well-structured dbt models trustworthy. As we will see in the use case below, this single change eliminates an entire category of stakeholder confusion.
3. Deployable and Testable
Because dashboards are code, they inherit everything that makes code reliable: automated testing, CI/CD pipelines, environment promotion (dev → staging → prod), and rollback capabilities. A broken metric definition fails the pipeline before it reaches your stakeholders — not after.
Rill Data: A Reference Implementation
Rill Data [1] is one of the leading platforms implementing BI-as-Code in practice. Its workflow is deliberately simple: everything is a flat file in a Git repository.
A typical Rill project contains:
- Source definitions — YAML files pointing to data sources (DuckDB databases, Parquet files, S3 paths, cloud warehouses)
- SQL models — transformation queries that shape the data for analytics use
- Metric views — YAML files declaring measures (e.g., SUM(revenue)) and dimensions (e.g., product_category) against a model
- Dashboard configurations — YAML files composing metric views into interactive dashboards
Architecture: Where BI-as-Code Sits in the Stack
The following diagram shows how BI-as-Code fits into the modern data stack, and — critically — where Git, CI/CD, and code review enter the picture.
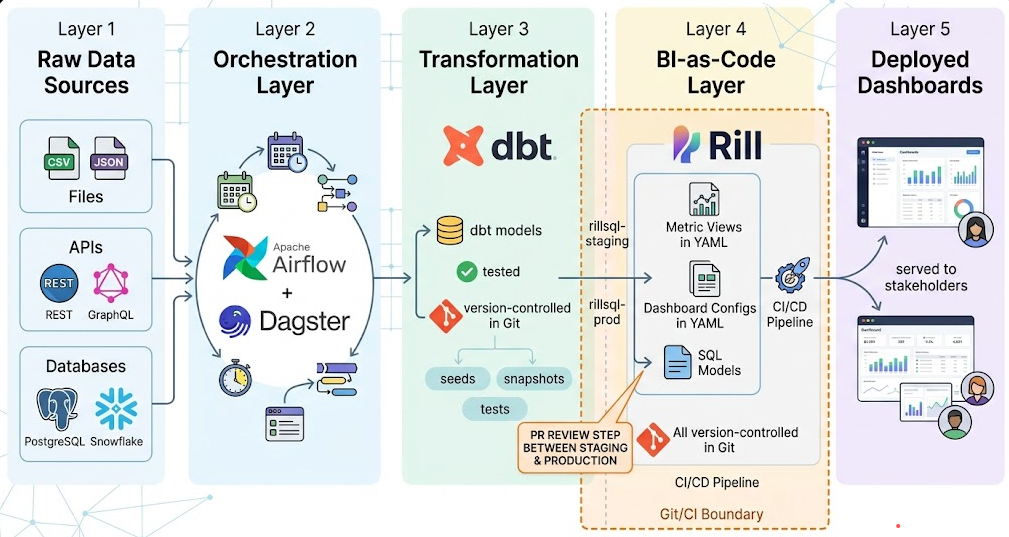
Image created using gemini
What this diagram makes clear is that the Git boundary — the point at which all changes require a peer review and pass automated tests — now extends all the way to the presentation layer. Previously, that boundary stopped at dbt. With BI-as-Code, it continues through to the dashboard configuration itself.
The key takeaway: your dashboards are now as auditable and as trustworthy as your transformation models.
BI-as-Code vs Traditional BI: A Direct Comparison
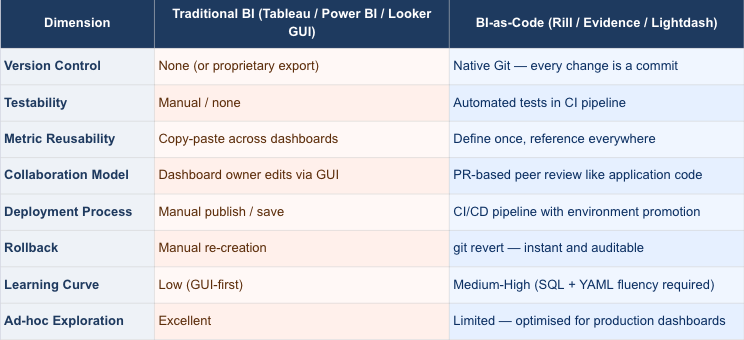
The trade-off in the last two rows is real, and we will address it honestly in the limitations section. But for production-grade, repeatable dashboards — the kind that stakeholders rely on daily — BI-as-Code wins across every other dimension.
A Real-World Use Case: The Revenue Dashboard Problem
Imagine a data team at a SaaS company managing a revenue dashboard in Looker. Over time, three separate dashboards have emerged: one for the sales team, one for finance, and one for the executive review. Each was built by a different analyst at a different time. Each has a slightly different definition of total_revenue — one includes refunds, one doesn't, one uses invoice date, one uses payment date.
Stakeholders now distrust the numbers. Every quarterly review starts with a 20-minute debate about which dashboard is “correct.”
Here’s how BI-as-Code resolves this:
Step 1 — Define the metric once. In a Rill metrics YAML file:
# metrics/revenue.yaml
version: 1
type: metrics_view
model: fct_revenue
measures:
  - name: total_revenue
    label: Total Revenue
    expression: SUM(net_revenue_after_refunds)
    description: "Revenue net of refunds, using payment date"
dimensions:
  - name: product_category
    column: product_category
  - name: region
    column: billing_region
Step 2 — Reference it across all dashboards. Each dashboard YAML simply references metrics/revenue.yaml as its source. The definition is identical everywhere because there is only one definition.
Step 3 — Test it in CI. A pipeline step validates that total_revenue returns expected values against a known test dataset before any change merges.
Step 4 — Track every change in Git. When finance requests a change to the revenue definition, an engineer opens a PR. The diff is visible. A second engineer reviews it. The change is approved, merged, and deployed — with a full audit trail.
The 20-minute debate disappears. The trust problem — which as we noted in the overview section is a tooling problem, not a people problem — is solved at its root.
The Gap Is Closing
The modern data stack has matured in layers. First came cloud data warehouses, which commoditised storage and compute. Then came dbt, which brought software engineering to transformation. Orchestrators like Airflow and Dagster brought it to pipelines. Each layer shifted from manual, proprietary tooling toward code-first, version-controlled, testable workflows.
The BI layer is the last holdout — and that’s changing fast. The teams that treat dashboards as code artefacts — not as afterthoughts managed in a GUI — will deliver faster, more reliable analytics with fewer “which number is right?” moments. The gap between engineering discipline and analytics delivery is closing, and BI-as-Code is the bridge.
If you’re already using dbt for transformation (code), Airflow for orchestration (code), and Terraform for infrastructure (code) — adding Rill for visualisation (code) isn’t a philosophical leap. It’s the logical completion of a workflow you’ve already committed to.
References
Rill Data — Rill: Fast Operational Dashboards — https://www.rilldata.com
Evidence — Evidence: Code-driven BI for data teams — https://evidence.dev
Lightdash: The open-source Looker alternative — https://www.lightdash.com
Found this useful? Follow me on Medium (aradsouza) or LinkedIn https://www.linkedin.com/in/alwynanildsouza/
for more practitioner-voice content on dbt, data mesh, and the modern data stack.
BI-as-Code: Bridging the Gap Between Data Engineering and Analytics was originally published in Towards Data Engineering on Medium, where people are continuing the conversation by highlighting and responding to this story.
This article was originally published at https://medium.com/towards-data-engineering/bi-as-code-bridging-the-gap-between-data-engineering-and-analytics-9da47a39fb8c?source=rss-670f6306e3c0------2